ProView32 is a fully featured and Integrated Development Environment that provides smooth seamless access to all the tools in the professional developers arsenal. From editing to debugging, ProView32 can manage all aspects of product development for any member of the 8051 family. CLICK HERE to download ProView32.

ProView32 is based on a fast multi-document editor designed to meet the specific needs of the programmers art. The various methods, menus, commands, and shortcuts are all fully compliant with the Microsoft® specifications for Win95® and Win NT®. Classic commands, such as string search and block actions, have been added to provide specific and advanced features for the professional developer. A (customizable) color syntax highlighting editor is used to indicate specific syntax elements as they appear in the source file: key words, comments, identifiers, operators, and so on. Whether it's C or assembler, the syntax highlighting is keyed to the intrinsic file type. This permits the professional user to quickly and easily identify those parts of the code responsible for syntactic errors; for instance, an unclosed comment. Other helpful commands; such as "search for matching delimiter" (i.e. bracket, parenthesis, …) make ProView32 a powerful easily used tool specifically dedicated to providing your embedded solution.

The project manager creates a link between the various files that comprise a project and the tools necessary to create that project. A project is dedicated to a target: 8051, 251 or XA; and each of the project's files are associated, by their file type, to the appropriate translating tool. C and assembler files are translated by the compiler and assembler, respectively. The linker manages object and library files, and output format conversion as necessary.
In addition, the user may define that other custom tools be used too, even DOS applications. Options for all tools are globally defined for the course of the project. As specific needs dictate, it is a simple matter to alter any file's individual attributes as necessary to achieve your goals.
The Project/Make command directs the integrated "make" utility to build or rebuild the target program for the current project. Each source file will be translated by its associated tool if any of its dependencies are found to be out of date. Dependency analysis, even of directly or indirectly included files, is automatic.

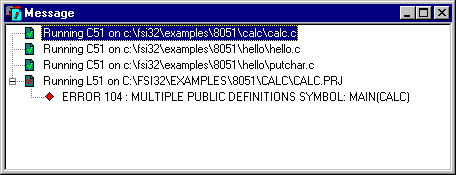
The message window displays all warning, error, and progress messages generated during the execution of each project or file.
Clicking on an error string in the message window automatically positions the cursor at the point of that error in the source code window. On-line context sensitive help is available to determine possible causes for that error.
The help system provides information on nearly all aspects of ProView32, and the various integrated tools driven by the IDE.
On-line menu hints appear on the status line whenever you select a menu command.
When a project is closed, editing and debugging contexts such as: kind, size and location of windows, breakpoints, "watch" expressions, and so on are saved. That same context is automatically restored should the project be reloaded or the debugging session be restarted.

ProView32 provides a fully integrated source level debugging environment. All information necessary is derived from the translators used to accomplish each step of the process. This includes mundane aspects such as "path names", and source code specific information such as complex type details.
With the simple click of a mouse button, the user can select among several powerful capabilities: simulate, monitor, or emulate. The fast smooth integration afforded by ProView32 promotes a feeling of familiarity and ease of use, while providing a level of comfort and efficiency that reduces the most difficult and complex applications to easily managed tasks. This seamless progression of the "code-translate-link-debug-test" cycle is the result of perfect communication between the programming tools and the debugger. This is the heart of ProView32.
ProView32 permits both integrated (fully interactive/multi-file "project" oriented), or standalone (interface only) debugging. In "project" mode, ProView32 presents and manages the entire display from source to final results; permitting detailed analysis of each line of source code. In the interface only, "debugger" mode, ProView32 provides a powerful and familiar interface for it's built-in debugger/simulator, or-via a fast and easy to use opto-isolated serial interface-connection to an external emulator (available separately) or target based ROM monitor. To round out these capabilities, ProView32 provides the additional benefit of being able to do "multi processor" simulation between several processors at the same time.
ProView32 includes simulation engines for most 8051, 80C251 and 80C51XA derivatives. The simulator/debugger is cleanly integrated into the presentation windows. A wide range of views can be selected to provide flexible direct examination of all memory spaces as well the all internal peripherals.
The simulation engines perform detailed and faithful simulations (including IDLE or Power down mode), of all peripherals-including interrupt and watchdog events-present on the selected component.
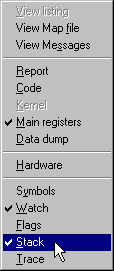
ProView32 provides a rich variety of views into an application:

These views are associated with control commands like complex breakpoints or high level trace recording.